
Subud Australia__________________
Demographic Survey
November 2008
Subud Australia Demographic Survey Report – December 2008
INDEX
Executive Summary
Introduction.
2.1 About the Survey
2.2 Survey Content
2.3 Methodology
Demographic Results
3.1 Number of Responses
3.2 Gender and Age Distribution
3.3 State
3.4 Length of Subud Membership
3.5 Generations in Subud
3.6 Time Residing Overseas
3.7 Marital Status
3.8 Partner Also Opened
3.9 Internet Use
3.10 Educational Qualifications
3.11 Employment
3.12 Hours of Paid Employment
3.13 Spiritual Affiliation Prior and Current
3.14 How Respondents Were Introduced to Subud
3.15 Attendance at Group Latihan
3.16 Attendance at Other Group or Regional Gatherings
3.17 Committee and Helper Position Frequency
3.18 Attendance at National and World Congress
3.19 Financial Contribution to Subud Australia
3.20 Meeting Spiritual and Emotional Needs
3.21 Level of Satisfaction/Support Received From Areas of Subud
3.22 Satisfaction With Subud’s Visibility in the Wider Community.
3.23 Ways to Increase Subud’s Visibility.
3.24 Speaking To Those Not In Subud
3.25 Should Subud Attract And Retain Members.
3.26 How to Attract and Retain New Members.
1. EXECUTIVE SUMMARY
One half of the Subud Australia population responded to the survey, which from a statistical viewpoint is a very high response rate and gives strong credibility to the results. On average we can deduce that three-fifths of Australia’s Subud population is female, and that a staggering 48% of those that answered either survey were aged 55 years and over. We are, indeed, an aging population, with no big resurgence for Subud Australia coming through youth.
Most Subud Australia members are married or in a committed relationship, and these relationships tend to be with other Subud members, most of whom were both members before marriage.
Probably the most significant finding of the survey is that 80% of respondents use the internet at least weekly, and of the 12% who don’t use the internet, only half of these require hard copies of material. This indicates that the Subud Australia website is the most promising means of communication that we have, both internally and externally.
Subud members are a surprisingly well-educated group, with the two highest employment sectors being Education and Health/Community Services. 70% of all respondents were in some form of employment, and an unusual number of these well past retiring age. 33% of respondents are either fully or partly self-employed, which is probably above the Australian average.
80% of respondents indicated that they attended a group latihan at least once a week, and 51% attend twice a week or more often. This would suggest that a large percentage of the Australian Subud population is actively connected to their local group and benefiting from the latihan.
The results indicate that while Subud is highly spiritually fulfilling for members, their social and emotional needs are less well met by the community. The Subud community has a large and varied array of people-resources at our disposal, with a large number actively connected to their local group. Time, energy, good will and commitment are resources that don’t depend on financial contributions. If people felt inspired and excited about an activity or project associated with Subud, then the survey results indicate that we probably have the resources to carry these out.
In terms of member’s financial contribution to Subud Australia, nearly half indicated that they were unclear as to what was required. Of those who did clearly state an opinion, the commitment asked was overwhelming deemed to be sufficient.
The activities in Subud that gives the highest satisfaction to members is clearly the latihan, Congress, and associated activities. The ‘Wings’ figure low in terms of satisfaction, and this probably ties in with the lower involvement and therefore response rate from survey participants.
Respondents are largely unsatisfied with Subud’s visibility in the greater community. There is strong debate, however, as to the best methods to increase this, with one group clearly equating any increased visibility as being against Bapak’s direction to “not advertise”. This corresponds with the high recommendations to make information ‘passively’ available, such as books in libraries or printed materials. While these sentiments are understood, survey results indicate that more recently joined Subud members are more likely to have been introduced by family or friend/colleague. ‘Passive’ information sources have not been a rich avenue at all in Australia for people to come in contact with the organization.
A second group observes that when Bapak was alive he actively traveled and reached out to people across the globe to inform them about the latihan. This group is interested in increasing the visibility of Subud and the latihan in Australia, so that people have the opportunity to explore it further, without there being any pressure exerted on them. Events open to the wider community and discussions or notices amongst spiritually-interested groups are the most recommended methods of increasing visibility. Friendliness and care shown toward new members will make them more likely to stay within the Subud community.
Many ‘free response’ comments were written on the survey forms indicating that members, particularly those who are second generation, feel ill-equipped to share their interest and involvement in Subud in a general conversation with friends or colleagues. Local and congress workshops and suggestions via the website are methods whereby people could be assisted with these skills. When viewed in light of the recent patterns of joining Subud, this becomes particularly significant: personal contact has overwhelmingly been the pathway to joining Subud, with 90% of respondents. Of these, nearly 40% are second generation members. 10% of new members have married into Subud; the remaining 40% hear of Subud through a friend or colleague. However, if people are generally feeling uncomfortable or unskilled in talking about Subud and the latihan, this method of information is diminished. While one third of participants indicated they discuss Subud with non-Subud persons at least monthly, another third only do this occasionally, and the remaining third stated ‘rarely or never’. Survey responses do not indicate the freedom with which this speech is happening, or whether this is to one friend repeatedly.
While there is some strong community feeling against proselytization or blatant forms of advertising, the majority of respondents would like Subud to be more visible in the wider community. Suggested non-intrusive means of making information available to the non-Subud community are varied and this leaves sufficient scope for groups and individuals to respond to interested persons, by whatever method seems most appropriate. Clearly, skilling members to be able to speak in a relaxed and natural way to interested people, of their own personal experiences of Subud, has the widest support amongst members.
Bavali Hill
Subud Australia Survey Manager.
02/01/09
2 Introduction
2.1 About the Survey
This report is of a survey of Subud Australia membership, undertaken by Bavali Hill, Council Member; in conjunction with National Vice Chair, Sophia Blake; National Chair, David Week; and assisted by Group Chairs, all on behalf of the Subud Council. The computer program was designed and written by a supportive member of the public, Bernie Creagh. The survey response period was from August to November 2008.
The purpose of the survey was to collect demographic data to gain a clearer view of the current membership population and also to gain a better understanding of members’ needs and views in relation to the services provided by Subud Australia.
2.2 Survey Content
Two surveys were designed. The first survey was divided into Parts 1 and 2, with Part 1 collating member’s identifying data for the Member’s National Address List, (name, `address, phone, email, Group). Part 2 asked further questions on birth date, gender, marital status, Subud generation, year opened, numbers of children opened, country of origin and level of Internet use.
The second survey, Part 3, sent out at the same time, ensured confidentiality by not containing any identifying information. It focused on identifying levels of disability, 2nd language fluency, education, occupation, number of hours worked weekly, level of involvement in other Spiritual practices before and after joining Subud, method of introduction to Subud, past and present level of involvement as either a Committee or as a Helper, attendance at Congress, income bracket, level to which Subud meets member’s spiritual and emotional needs, satisfaction with Subud’s visibility in the community, frequency of speaking to non-members about Subud, whether we should try to retain and attract new members to Subud and the best methods to do this.
See Addendum for copies of both survey forms.
2.3 Methodology
Questions were ratified by the Subud Australia Council with additional questions added by Group Chairs. The focus was on open ended questions to reduce any influence on member’s answers. Sophia Blake, Vice Chair, played a significant advisory role throughout each stage of the project and two Councilors with prior survey experience, Hannah Thomas and Chad Foulkes, both gave detailed and valuable feedback. David Weeks, the National Chair, who first proposed a National Survey, asked challenging questions that helped refine not just the survey fields, but also the methodology.
Survey packs were sent to each Group Chair and in total contained 750 copies of Surveys 1 and 2, printed on white and green paper to aid easy identification; white and green envelopes were included so surveys would be separated to aid confidentiality; instructions; address labels; inserts when sending to members long absent; and completed with pens and coloured paper to assist in covering two collection boxes.
Groups either gave out the two surveys to members at latihan gatherings, or posted them out. Sydney experimented with personal distribution via small ‘pod’ groups and this may have accounted for their greater percentage returns amongst the higher population Groups.
3. Demographic Results
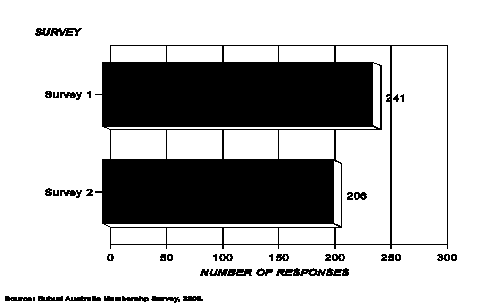
3.1 Numbers of responses.
241 surveys were returned for Survey 1 and 206 for Survey 2. With Subud Australia active membership somewhere between 400 and 450, (although the mailing list totals around 700 to 750), these returns represent a very creditable response rate of 54 to 60% for Survey 1, and of 48 to 51% for Survey 2.
Graph 1. Total
Survey Responses
Number of Respondents
3.2 Gender and age distribution.
Gender distribution was fairly constant between Survey 1 and Survey 1, with a slight tendency for proportionately more males than females to answer Survey 2.
Survey 1 had 89 males and 149 females respond (36.9% males to 61.8% females), whereas Survey 2 had 80 males to 124 females (38.8% males to 60.3% females). Around 1% did not state their gender.
That Australia has an aged membership is evident from the figures in Tables 1 and 2, and in Graph 2, which shows that 27% of respondents were aged 40-54 years; 34% were aged 55-69 years and 15% were 70 years and over. This means that a staggering 48% of those who answered either Survey were aged 55 years and over. An additionally sobering figure is that those respondents over 70 years are roughly equal to those in the 25 to 39 years age bracket (18%), where energy levels and drive is considered to be highest.
In Australia there is no big resurgence through Youth, as this age group, 17 to 24 years, comprised only 4% of respondents. A larger number of youth may have answered if the survey had been administered via the net, (although this may have deterred other groups), or a more probable conclusion is that Subud Australia has a small Youth population.
Table
1. Survey 1 Respondents by Age and by Gender.
MALE FEMALE NOT STATED TOTAL
AGE No. % No. % No. % No. %
17-24
years 2 2.2% 6 4.0% 1 33.3% 9 3.7%
25-39
years 17 19.1% 26 17.4% 0 0.0% 43 17.8%
40-54
years 19 21.3% 39 26.2% 0 0.0% 58 24.1%
55-69
years 33 37.1% 47 31.5% 0 0.0% 80 33.2%
70
years + 14 15.7% 22 14.8% 0 0.0% 36 14.9%
Not
stated 4 4.5% 9 6.0% 2 66.7% 15 6.2%
TOTAL 89 100.0% 149 100.0% 3 100.0% 241 100.0%
% 36.9% 61.8% 1.2%
Question
6: DOB?
Question
7: Gender?
Source:
Subud Australia Membership Survey, 2008.
Table
2. Survey 2 Respondents by Age and by Gender.
MALE FEMALE NOT
STATED TOTAL
AGE No. % No. % No. % No. %
17-24
years 3 3.8% 6 4.8% 1 50.0% 10 4.9%
25-39
years 15 18.8% 23 18.5% 0 0.0% 38 18.4%
40-54
years 19 23.8% 36 29.0% 0 0.0% 55 26.7%
55-69
years 31 38.8% 37 29.8% 1 50.0% 69 33.5%
70
years + 11 13.8% 20 16.1% 0 0.0% 31 15.0%
Not
stated 1 1.3% 2 1.6% 0 0.0% 3 1.5%
TOTAL 80 100.0% 124 100.0% 2 100.0% 206 100.0%
% 38.8% 60.2% 1.0%
Question
24: Age?
Question
25: Gender?
Source:
Subud Australia Membership Survey, 2008.
Graph 2. Age
Distribution
% of Respondents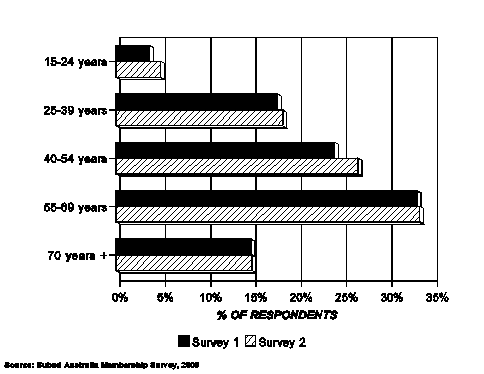
State
Graph 4 shows distribution of respondents by State, which roughly follows the distribution by numbers in each State, with the exception of NSW, which had a proportionally higher rate of return.
Graph 4. State of Residence
%
of Respondents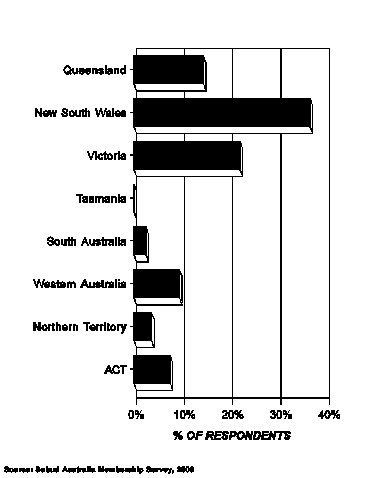
3.4 Length of Subud Membership.
Table 6 lists length of membership in 5 year age grouping by gender. The largest group is those newly joined Subud, with 30 respondents at less than 5 years and this growth is sustained in the next two groups with 21 people at 5-10 years and 25 people at 11-15 years.
The numbers drop off slightly for those who have been members from 16 to 30 years, but again pick up in the next three groups, with 23 people at 31-35 years, 22 people at 36-40 years, and 20 people at 41-45 years. Interestingly, the group with most longevity of membership, 51-55 years, had 7 respondents.
It is difficult to make definitive conclusions of these figures without fuller analysis, however, it can be said that the slightly larger numbers in those most recently joined have yet to experience the attrition that naturally occurs over time. Also, in order for this more recently joined group to continue on and stay members, their needs will have to be consistently met over time.
Table 6. Survey Respondents by Length of Time as Subud Member and by Gender.
MALE FEMALE NOT STATED TOTAL
LENGTH OF TIME AS SUBUD MEMBER No. % No. % No. % No. %
Less than 5 years 9 11.3% 19 15.3% 2 100.0% 30 14.6%
5-10 years 7 8.8% 14 11.3% 0 0.0% 21 10.2%
11-15 years 8 10.0% 17 13.7% 0 0.0% 25 12.1%
16-20 years 4 5.0% 7 5.6% 0 0.0% 11 5.3%
21-25 years 10 12.5% 9 7.3% 0 0.0% 19 9.2%
26-30 years 4 5.0% 10 8.1% 0 0.0% 14 6.8%
31-35 years 9 11.3% 14 11.3% 0 0.0% 23 11.2%
36-40 years 11 13.8% 11 8.9% 0 0.0% 22 10.7%
41-45 years 10 12.5% 10 8.1% 0 0.0% 20 9.7%
46-50 years 3 3.8% 7 5.6% 0 0.0% 10 4.9%
51-55 years 3 3.8% 4 3.2% 0 0.0% 7 3.4%
56-60 years 0 0.0% 0 0.0% 0 0.0% 0 0.0%
Not stated 2 2.5% 2 1.6% 0 0.0% 4 1.9%
TOTAL 80 100.0% 124 100.0% 2 100.0% 206 100.0%
% 38.8% 60.2% 1.0%
Question 26: Length of time as a Subud member?
Source: Subud Australia Membership Survey, 2008.
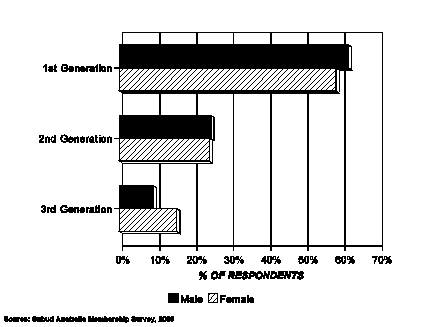
3.5 Generations in Subud
Of the respondents to the Survey, 59% were 1st generation members; 24% were second generation members and 13% were third generation members. This indicates a strong family connection to the membership, as just over 1/3 of the total has either parents or grandparents who were opened.
Graph
7. Subud Generation
% of Respondents
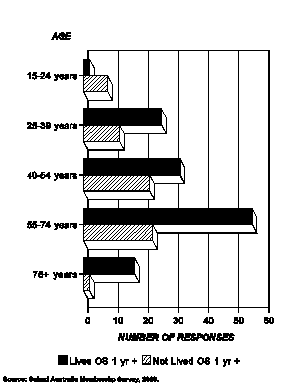
3.6 Time Residing Overseas
Subud is considered to be a well traveled group of people and the survey bore this out, showing that 65.5% of respondents stated that they had lived outside Australia for one year or more. Of this group, 38% were aged 55 to 74 years of age and were by far the largest group of travelers.
Graph 14. Time Residing Overseas
% of Respondents
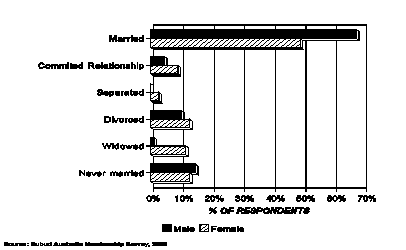
3.7 Marital Status
Most Subud Australia members are married, 67%, with 4% in committed relationships, 10% divorced, 1% widowed and 15% never married. This suggests conservative attitudes to relationships and also may be accounted for by the popular belief that latihan practice leads to more balanced and authentic relationships.
Graph 14. Marital Status
% of Respondents
3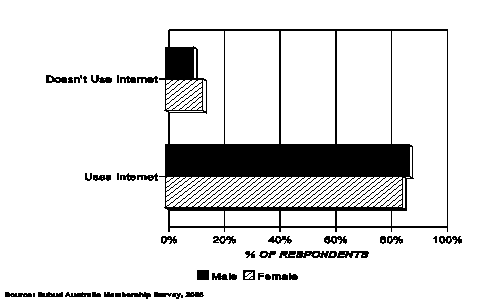 .8 Partner
Also Opened
.8 Partner
Also Opened
O
Graph
18. Relationships
% of Respondents
Internet Usage
A very significant result from the Survey has been that despite the assumption that older people are less likely to use the internet, Subud Australia members are regular users. In fact only 12% do not use the internet, and 80% of respondents use the Internet at least weekly. Interestingly, due to the prior assumption that older Subud members were not net savvy, the survey was only administered via hard copy. Future surveys could consider using electronic methods for delivery and response.
Of the 12% of respondents who do not use the Internet, only half of these (5.8%) required hard copy of material to be available to them.
The Survey confirmed that up until recently most members do not access the Subud Australia website. However, these difficulties are in process of being addressed and the aim is to reverse this trend. (Watch this space!!!)
Graph
23. Internet Usage by Gender
% of Respondents
Graph
25. Frequency of Internet Usage by Age
% of Respondents
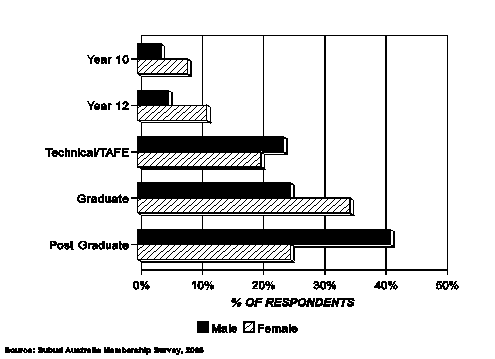
3.10 Educational Qualifications
The survey revealed that Subud members were a surprisingly well educated group with 31% holding a degree, and a further 32% holding postgraduate degrees. This means 63% of Subud members possess graduate and post graduate qualifications, well above the Australian norm.
Graph
30. Qualifications
% of Respondents
3.11 Employment
Graph 33 shows the breakdown of occupations, with the two modes being Education at 15.5% and Health & Community Services 13.6%.
70% of all respondents were in some form of employment and 32.5% of all respondents were fully or partly self-employed. These results are remarkable considering almost 50% of respondents were aged 55 years or over. Some possible conclusions are that those with professional background are more likely to stay in employment in later age and that there is a strong preference in the Subud community for self-employment.
Graph 33. Occupation
%
of Respondents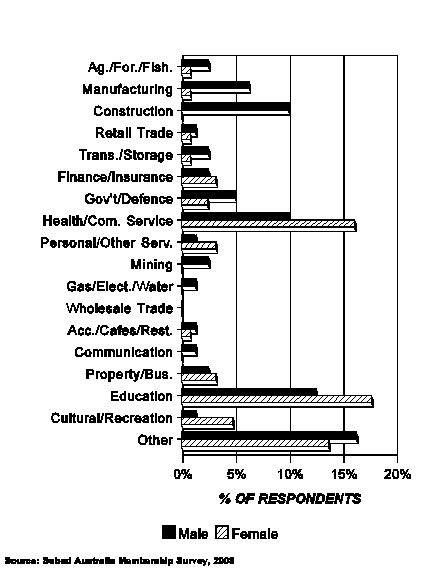
Graph
34. Full-time vs Part-time
Employment
by Gender
%
of Respondents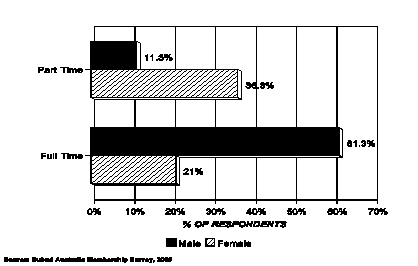
Hours of Paid Employment
There is gender equality amongst respondents who are not in paid employment (26% of men and 29% of women) and these comprise 28% of our total respondents. Of the numbers who are in paid employment 27% reported that they worked part-time (up to 34 hours per week) and 37% work full time.
Table 30. Survey Respondents by
Hours Worked and by Gender.
MALE FEMALE NOT
STATED TOTAL
HOURS
WORKED No. % No. % No. % No. %
Not Employed (Nil
hours) 21 26.3% 37 29.8% 0 0.0% 58 28.2%
Employed
Respondents:
Part-time:
1-10
hours 0 0.0% 11 8.9% 0 0.0% 11 5.3%
11-25
hours 7 8.8% 22 17.7% 0 0.0% 29 14.1%
26-34
hours 2 2.5% 12 9.7% 1 50.0% 15 7.3%
Sub-Total
(Part-time) 9 11.3% 45 36.3% 1 50.0% 55 26.7%
Full-time:
35-40
hours 28 35.0% 17 13.7% 0 0.0% 45 21.8%
41-50
hours 13 16.3% 4 3.2% 1 50.0% 18 8.7%
51-60
hours 6 7.5% 3 2.4% 0 0.0% 9 4.4%
61 +
hours 2 2.5% 2 1.6% 0 0.0% 4 1.9%
Sub-Total
(Full-time) 49 61.3% 26 21.0% 1 50.0% 76 36.9%
Not stated
(Hours) 1 1.3% 12 9.7% 0 0.0% 13 6.3%
Sub-total
(Employed) 59 73.8% 83 66.9% 2 100.0% 144 69.9%
Not stated
(Employment) 0 0.0% 4 3.2% 0 0.0% 4 1.9%
TOTAL 80 100.0% 124 100.0% 2 100.0% 206 100.0%
% 38.8% 60.2% 1.0%
Question
36: Are you currently in paid employment?
Question
37: How many hours, on average, do you work per week?
Source:
Subud Australia Membership Survey, 2008.
3.13 Spiritual Affiliation Prior and Current
Prior to coming to Subud, 53% of respondents stated that they had no previous spiritual or religious affiliation. Of those 45% who had an affiliation, 14% were Anglican, 10% were Catholic, 6% were Protestant, and Moslem and Buddhism together accounted for a total of 5% (2.4% each). Respondents may have indicated more than one area of prior spiritual orientation.
Once people have become Subud members, the number now naming they have a spiritual orientation has risen remarkably, not just for Subud, but in almost all categories of spiritual orientation. This may be due to Bapak having urged members to have a religion for its moral teachings, as well as practice the Latihan.
However, only 60% of those Subud members who responded to the survey listed Subud as a current spiritual orientation. This could have been affected by the survey wording, or it may be due to people disinclined to own Subud in any official capacity. Predictably, the number who named Moslem as a current orientation had leapt to 15%, presumably due to many members who lived with Bapak having adopted his cultural expression. Buddhism had risen to 7.3%. Again, respondents may have indicated more than one area of current spiritual orientation.
Graph 37. Prior and Current
Spiritual Orientations
% of Respondents
Graph 38. Current Spiritual
Orientations
%
of Respondents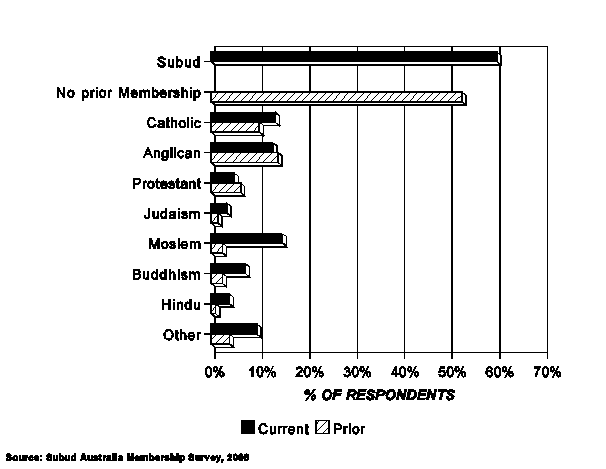
Table 34. Survey
Respondents by Prior Spiritual Movements and by Length of time as
Subud Member.
Note: Respondents could
identify more than one movement
LENGTH OF TIME AS
SUBUD MEMBER
0-10
YEARS 11-20 YEARS 21-30 YEARS 31-40 YEARS
RELIGION No. % No. % No. % No. %
No prior
membership 27 52.9% 22 61.1% 22 66.7% 23 51.1%
Had Prior Membership:
Catholic 5 9.8% 4 11.1% 6 18.2% 3 6.7%
Anglican 6 11.8% 2 5.6% 0 0.0% 10 22.2%
Protestant 2 3.9% 1 2.8% 2 6.1% 6 13.3%
Judaism 0 0.0% 0 0.0% 0 0.0% 0 0.0%
Moslem 3 5.9% 2 5.6% 0 0.0% 0 0.0%
Buddhism 3 5.9% 1 2.8% 0 0.0% 0 0.0%
Hindu 2 3.9% 0 0.0% 0 0.0% 0 0.0%
Other 2 3.9% 2 5.6% 0 0.0% 1 2.2%
Not stated (Prior
Movement) 0 0.0% 1 2.8% 1 3.0% 0 0.0%
Sub-Total
(Prior Membership) 24 47.1% 14 38.9% 10 30.3% 21 46.7%
Not
stated (Prior Membership) 0 0.0% 0 0.0% 1 3.0% 1 2.2%
TOTAL 51 100.0% 36 100.0% 33 100.0% 45 100.0%
% 24.8% 17.5% 16.0% 21.8%
41-50
YEARS 51-55 YEARS NOT STATED TOTAL
No. % No. % No. % No. %
No prior
membership 12 23.5% 1 14.3% 2 50.0% 109 52.9%
Had Prior Membership:
Catholic 3 10.0% 0 0.0% 0 0.0% 21 10.2%
Anglican 7 23.3% 3 42.9% 1 25.0% 29 14.1%
Protestant 2 6.7% 0 0.0% 0 0.0% 13 6.3%
Judaism 2 6.7% 1 14.3% 0 0.0% 3 1.5%
Moslem 0 0.0% 0 0.0% 0 0.0% 5 2.4%
Buddhism 0 0.0% 1 14.3% 0 0.0% 5 2.4%
Hindu 0 0.0% 0 0.0% 0 0.0% 2 1.0%
Other 2 6.7% 1 14.3% 0 0.0% 8 3.9%
Not stated (Prior
Movement) 0 0.0% 0 0.0% 1 25.0% 3 1.5%
Sub-Total (Prior
Membership) 16 53.3% 6 85.7% 2 50.0% 93 45.1%
Not
stated (Prior Membership) 2 6.7% 0 0.0% 0 0.0% 4 1.9%
TOTAL 30 100.0% 7 100.0% 4 100.0% 206 100.0%
% 14.6% 3.4% 1.9% 100.0%
Question
26: Length of time a Subud member?
Question
41: Were you a member of another spiritual
movement/practice/religion before joining Subud?
Question
42: Of which movement/practice/religion were you a member?
Source:
Subud Australia Membership Survey, 2008.
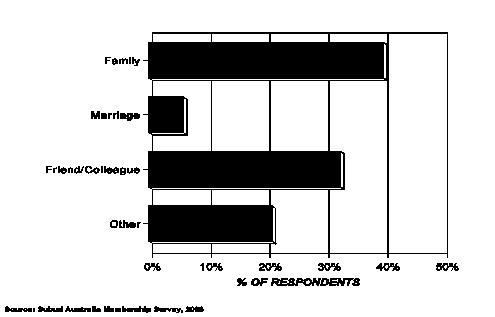
How Respondents were Introduced to Subud.
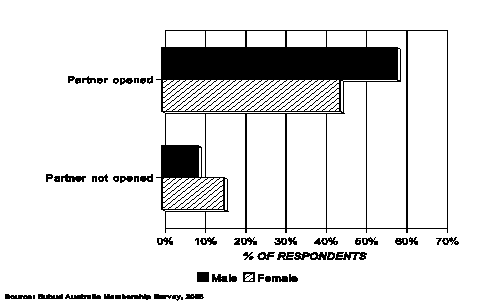
40% of respondents first heard about Subud from a family member, which is in line with our earlier observation that 37% were second or third generation Subud members. The next highest method of introduction was via a friend or colleague and this accounted for 32.5% of all respondents, while only 6% came via marriage.
However, as 76% of partnered/married Subud members have a partner who is also in Subud, then the Survey results indicate the high degree to which Subud members tend to seek a partner from within the Subud population and regard this as important.
Only half of the 21% who stated they heard of Subud via a means other than by family, marriage or friend/colleague, gave information on the source. Six of these wrote Gurdjief or John Bennett, 4 came via a library and three by reading a book, while 3 talked of ‘coincidence’ or through ‘searching’. The age of these 21% was almost entirely greater than 50 years.
This is significant as the more recently a person has joined Subud, the more likely their method of introduction has been via family or friend/colleague, and the less likely other means (Gurdjief, library, book, searching for instance), has played a part. See Table 38. This is very likely to be caused by a reduction over time in the availability of sources of information about Subud, with library use, for instance, having dropped dramatically over time, as use of the electronic medium has increased.
Graph 40. Method of Introduction
to Subud
%
of Respondents
Table
38. Survey Respondents by Method of Introduction to Subud and by
Length of Time as Subud Member.
LENGTH
OF TIME AS SUBUD MEMBER
0-10
YEARS 11-20 YEARS 21-30 YEARS 31-40 YEARS
METHOD
OF INTRODUCTION No. % No. % No. % No. %
Family 19 37.3% 22 61.1% 14 42.4% 16 35.6%
Marriage 5 9.8% 1 2.8% 1 3.0% 5 11.1%
Friend/Colleague 22 43.1% 10 27.8% 12 36.4% 14 31.1%
Other 5 9.8% 3 8.3% 6 18.2% 9 20.0%
Not
stated 0 0.0% 0 0.0% 0 0.0% 1 2.2%
TOTAL 51 100.0% 36 100.0% 33 100.0% 45 100.0%
% 24.8% 17.5% 16.0% 21.8%
41-50
YEARS 51-55 YEARS NOT STATED TOTAL
METHOD
OF INTRODUCTION No. % No. % No. % No. %
Family 10 33.3% 0 0.0% 1 25.0% 82 39.8%
Marriage 0 0.0% 0 0.0% 0 0.0% 12 5.8%
Friend/Colleague 7 23.3% 1 14.3% 1 25.0% 67 32.5%
______78%
Other 13 43.3% 6 85.7% 1 25.0% 43 20.9%
______21%
Not
stated 0 0.0% 0 0.0% 1 25.0% 2 1.0%
TOTAL 30 100.0% 7 100.0% 4 100.0% 206 100.0%
% 14.6% 3.4% 1.9% 100.0%
Question
44. How were you introduced to Subud?
Source:
Subud Australia Membership Survey, 2008.
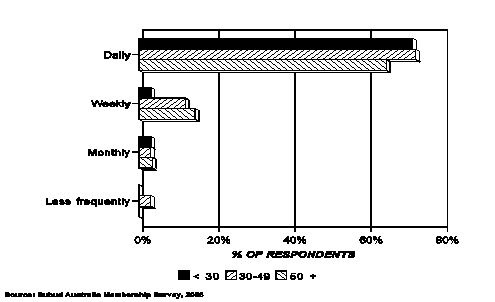
3.15 Attendance at Group Latihan
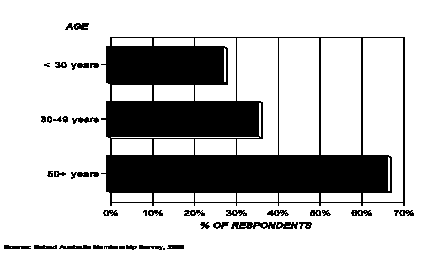
80% of respondents indicated that they were active Subud members, (attending latihan at least once a week), and 51% attended twice a week or more often. Hence, it is clear that the respondents to the survey came from those members who have regular and frequent interaction with the Subud community and regard lathihan attendance as important. Distant and remote members of course do not have geographical access to latihan. The attendance remains high over all age groups, though is highest (85%) in the 50+ age group, next highest (78%) in the under 30 years age group, and falls to 53% in the 30 to 49 age group, which is when child care and work responsibilities more commonly can present competing demands.
When the figures are collated by the National Helpers, on latihan attendance in 2008 over the Australian Subud population, then these results will give a useful comparison.
Table 40. Survey
Respondents by Frequency of Attendance at Latihan and by Age.
AGE
<
30 YEARS 30-49 YEARS 50 YEARS + TOTAL
FREQUENCY
OF ATTENDANCE No. % No. % No. % No. %
More
than twice a week 1 5.6% 6 9.8% 31 24.4% 38 18.4%
Twice
a week 5 27.8% 15 24.6% 47 37.0% 67 32.5%
Once
a week 8 44.4% 18 29.5% 30 23.6% 56 27.2%
SUBTOTAL
(min. once per week) 14 77.8% 39 52.9% 108 85% 161 78.1%
Twice
a month 1 5.6% 4 6.6% 4 3.1% 9 4.4%
Once
a month 2 11.1% 6 9.8% 5 3.9% 13 6.3%
6
times a year 0 0.0% 2 3.3% 3 2.4% 5 2.4%
3-4
times a year 0 0.0% 4 6.6% 1 0.8% 5 2.4%
Once
a year 0 0.0% 1 1.6% 2 1.6% 3 1.5%
Less
than yearly/Never 1 5.6% 5 8.2% 3 2.4% 9 4.4%
Not
stated 0 0.0% 0 0.0% 1 0.8% 1 0.5%
TOTAL 18 100.0% 61 100.0% 127 100.0% 206 100.0%
% 8.7% 29.6% 61.7%
Question
45: Frequency with which you currently attend Group Latihan?
Source:
Subud Australia Membership Survey, 2008.
3.16 Attendance at Other Group or Regional Gatherings
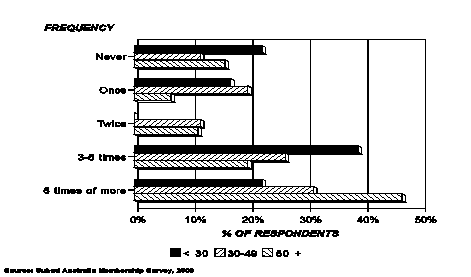
Conversely to group latihan attendance, the majority of members reported low attendance at Group or other regional gatherings, with 40% rating this as ‘once a year’ and 42% rating this at between ‘3 to 6 times a year’. This trend was evident across all age groups and is probably influenced by many Groups having few social or Wings events outside occasional Kedjiwan days, and of course Regional members are limited by distance.
Graph 45. Frequency
of Attendance at Other Group or Regional Gatherings
% of Respondents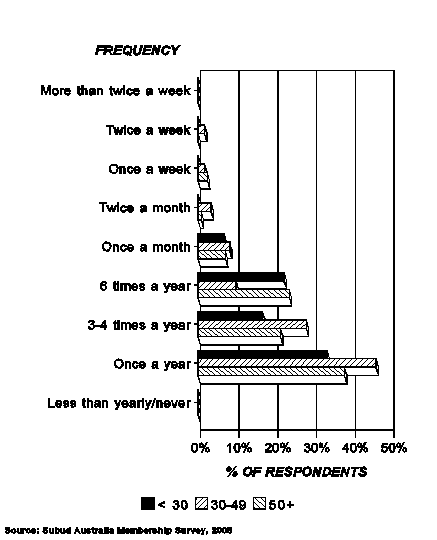
3.17 Committee and Helper Position Frequency
It was expected that when 38% of respondents recorded they had never held a Local Group position, that this proportion would increase with National (67%) and International Committee positions (87.5%). When the three levels are compared, women on average appear to be less well represented at the local Group level.
Graph
46. Frequency of Holding
Local
Group Position/Role
% of Respondents
Graph
47. Frequency of Holding
National
Position/Role
% of Respondents
Graph
48. Frequency of Holding
International
Position/Role
% of Respondents
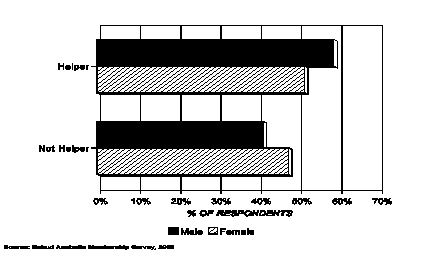
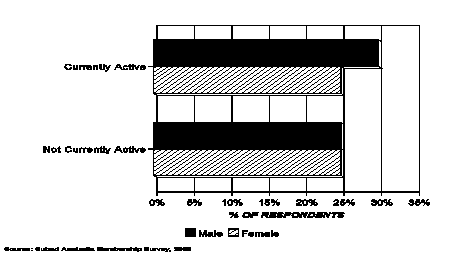
However, with Helper positions, another trend is evident and that is that while 54.5% of respondents identified themselves as Helpers, only 27% recorded that they were currently active in this role. In line with the weighting of Australian Subud membership towards 50 years and higher, the highest number of Helpers are in this demographic and represent 62% of all respondents.
Graph
49. Helpers by Gender
% of Respondents
Graph
50. Helper Activity by Gender
% of Respondents
Graph
51. Helpers by Age
% of Respondents
Attendance at National and World Congress
Attendance at National Congress is highly valued, judging by the 85% of all respondents who have attended a National Congress at least once, with 23% having attended National Congress 3 to 5 times, and a very significant 40% having attended 6 National Congresses or more. While World Congress attendance obviously presents more of a challenge, due to cost and distance, the trend is still for high attendance, with 62% of all respondents having attended at least once, and 25% having attended 3 times of more.
Graph
55. Attendance at National Congress by Age
% of Respondents
3.19 Financial Contribution to Subud Australia
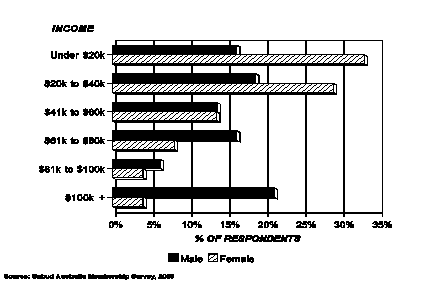
Given the age demographic of Subud Australia, with many members well into their retirement years, the income level is reasonably high, with roughly 27% of respondents earning under $20k.p.a; 25% earning between $20k - $40k.p.a; 14% earning between $41k - $60k.p.a, and 16% of respondents earning between $61k - $100k per annum. A further 10.7% of respondents listed their annual income at over $100.p.a. and 7.8% did not respond, despite stringent measures to ensure anonymity.
Graph
59. Income by Gender
% of Respondents
Respondents were asked, “Is it clear what level of financial support is needed from you to meet Subud’s basic operating commitments?”, to which 36.5% answered ‘No”. This is clearly an issue that needs to be addressed by the National Council. Another 11% did not give any answer to this question, which usually indicates uncertainty.
Despite the lack of clarity around recommended annual financial contributions to Group and National functioning, of those who felt ‘clear’ on this topic, 85% of this group stated that the requested amount was ‘sufficient’ and 5.3% thought it was ‘too low”. No one checked that they considered the requested amount was “too high”.
Table 61. Survey
Respondents by Income and by Clarity About Financial Commitments.
CLEAR UNCLEAR NOT
STATED TOTAL
ANNUAL
INCOME No. % No. % No. % No. %
Under
$20k 26 23.9% 21 28.0% 8 36.4% 55 26.7%
$20k
TO $40k 20 18.3% 29 38.7% 2 9.1% 51 24.8%
$41k
TO $60k 18 16.5% 9 12.0% 2 9.1% 29 14.1%
$61k
TO $80k 13 11.9% 6 8.0% 4 18.2% 23 11.2%
$81k
TO $100k 9 8.3% 1 1.3% 0 0.0% 10 4.9%
$100k
plus 17 15.6% 5 6.7% 0 0.0% 22 10.7%
Not
stated 6 5.5% 4 5.3% 6 27.3% 16 7.8%
TOTAL 109 100.0% 75 100.0% 22 100.0% 206 100.0%
% 52.9% 36.4% 10.7%
Question
57: What is your gross yearly income bracket?
Question
58: Is it clear what level of financial support is needed from you
to meet Subud’s basic operating commitments?
Source:
Subud Australia Membership Survey, 2008.
Meeting Spiritual and Emotional Needs
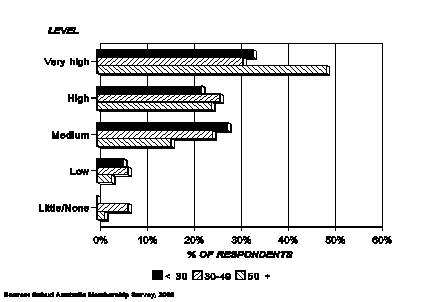
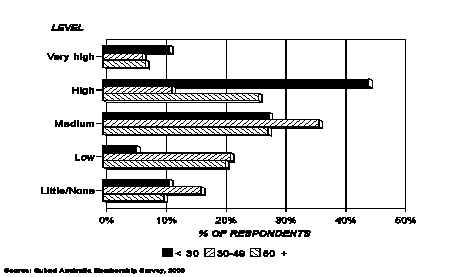
When asked, “The level to which Subud fills your current spiritual needs”, 67% of respondents recorded ‘very high’/ ‘high’, 20% recorded ‘medium’ and 7% recorded ‘low’ or ‘little to none”.
“Fills your Social/Emotional needs” fared a little lower in comparison with only 30.5% of respondents recording that Subud filled these needs at a ‘very high’/ ‘high’ level; 30% recorded ‘medium’ level, and 31.5% recorded a ‘low’ level or ‘little to none’.
That, “fills your spiritual needs” is at a high level concurs with the previous finding of very high and regular attendance at Group latihan practice across all age groups. Further analysis of the results is required to determine if the somewhat lower result for “fills your social/emotional needs” is restricted to smaller groups where travel or size inhibits gatherings after latihan, or where more regular social or Wings events are less viable.
However, when these responses are looked at across the different age groups, the under 30 years age group scored 83% of all respondents for medium to very high ‘meets spiritual needs’ and also 83% for medium to very high ‘meets social/emotional needs’, suggesting that this age group makes maximum benefit from both opportunities. The 30 to 49 age group scored 82% for medium to very high ‘meets spiritual needs’ and 54% for ‘meets social/emotional needs’, while the 50+ yrs age group scored 89% for ‘meets spiritual needs’ and 61% for ‘meets social/emotional needs’. Between 6 and 8% of all respondents did not respond to a request to rate either category.
Table
63. Level to Which Subud Meets Current Needs.
SPIRITUAL SOCIAL/EMOTIONAL
LEVEL
SUBUD MEETS NEEDS No. % No. %
Very
high 87 42.2% 15 7.3%
High 51 24.8% 48 23.3%
Medium 40 19.4% 62 30.1%
Low 9 4.4% 40 19.4%
Little/None 6 2.9% 25 12.1%
Not
stated 13 6.3% 16 7.8%
TOTAL 206 100.0% 206 100%
Question
60: Level to which Subud fills your current spiritual needs?
Source:
Subud Australia Membership Survey, 2008.
Graph
63. Meeting Spiritual Needs by Age
% of Respondents
Graph
65. Meeting Current Social/Emotional
Needs
by Age
% of Respondents
3.21 Level of Satisfaction/Support Received From Areas of Subud
Graph 98 gives a clear and fascinating picture of the satisfaction that respondents gain from many aspects of their Subud lives. Group latihan, individual latihan and Congress are those rated highest with 41% to 63.5% of all respondents rating these categories as providing ‘very high’ or ‘high’ satisfaction. The next grouping is fellowship in general, Kedjiwan, Helpers, Group social events, space to contribute and Subud literature, with between 26% and 35% of respondents rating these categories as providing ‘very high’ or ‘high’ satisfaction. Regional events, space to use/develop skills, and all the Wings rated lowest with only 4.5% to 21%of respondents rating these as providing ‘very high’ or ‘high’ satisfaction.
The method of recording ‘level of satisfaction’ was on a 5 point Leichart Scale with ratings ‘very high’, ‘high’, ‘medium’, ‘low’, ‘little to none’. Response rate for each item listed varied from 85% responding on the most popular items to 70% responding to the items lower in the table, which included all the Wings items. It could be argued that placement in the table may have affected response rate as people got tired of ticking boxes. However, one item, ‘space to make a contribution’ was listed third last item from the bottom, yet scored a mid rating, so this hypothesis needs further data analysis before it could be considered valid.
Graph 98.
Satisfaction Summary
Very
High and
High
Responses
% of Respondents
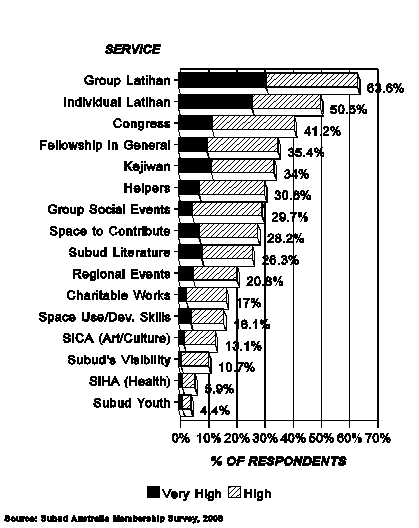
The possible use overall that we could make from these results `is to provide a re-evaluation of where we allocate Subud member time, energy and resources, by focusing on those items which people rate as giving them most satisfaction and allocating less time and resources on those that are perceived as providing less satisfaction. Certainly members are more likely to support activities from which they consider they gain personal value.
Alternatively, the results also could be used to provide fresh incentive to revamp those areas in Subud which were rated as providing lowest satisfaction, by looking at how these items are organized and what services and opportunities they provide the wider membership.
3.22 Satisfaction With Subud’s Visibility in the Wider Community.
Satisfaction is generally low, with 47% of respondents rating their satisfaction as ‘low’ to ‘little or none’, and only 11% rating it as ‘high’ or ‘very high’. One third rated it as ‘medium’ and a further 11% did not answer this question.
Table
97. Satisfaction in Subud's Visibility.
TOTAL
SATISFACTION
LEVEL No. %
Very
high 2 1.0%
High 20 9.7%
Medium 66 32.0%
Low 65 31.6%
Little/None 31 15.0%
Not
stated 22 10.7%
TOTAL 206 100.0%
Question
63: How satisfied are you with Subud's visibility in the wider
community?
Source:
Subud Australia Membership Survey, 2008.
Ways to Increase Subud’s Visibility.
That Subud Australia has been given a clear mandate to act to increase the visibility of Subud in the wider community cannot be disputed. Graph 99 sets out views on the best methods to achieve this, with ‘books in libraries’ scoring by far the highest response by 46% of respondents. ‘Use of notices in spiritual magazines’ and an ‘improved information leaflet’ scored 29.1% and 29.6% of votes respectively.
The next group of methods included ‘articles in papers or magazines’, ‘open house nights’, ‘spiritual fair stalls’ and ‘hall signage’, receiving between 25% to 22 % of the votes each.
Via a ‘personal approach’ received only 18% of votes, yet this is how a large number of members themselves found Subud, and this method is universally regarded as the best method for information or recruitment in community work fields.
‘Radio’, ‘Community notice boards’ and ‘talks by Helpers and Chairs’, received16% to 14% votes, while ‘letter box drops’ came in lowest as a method to increase visibility, receiving just 2.4% of votes.
Graph 99. Suggested
Activities to Assist
Subud’s
Visibility in the Wider Community
% of Respondents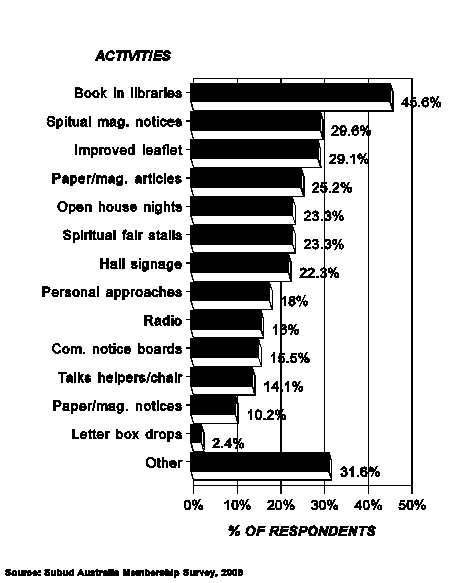
An interesting distinction was that while ‘spiritual magazine notices’ was highly regarded (29.6%), as was ‘articles in papers and magazines’ (25%), mere ‘notices in papers and magazines’ was not seen as useful, with only 10.2% of votes. Respondents seemed to indicate that they viewed notices as likely to have more success if targeted at a similarly spiritually inclined readership (in magazines such as the free monthly newspaper Nova), than if in a general newspaper or magazine with more general audience. Also, an article, which has space for more detailed information and explanation was perceived as likely to be more successful than a smaller and less informational ‘notices in papers and magazines’ (10%).
An anomaly is that very highly voted ‘books in libraries’ (46% voted for this method), was in fact the method of entry to Subud for only 3.5% of respondents who answered this question. Thus the survey suggests that books and libraries have not ever been a widely successful method in Australia to inform about Subud. It is possible of course that the written word may have been used to give supplementary information once a person was already interested in Subud, or once they were already a member.
Additionally, libraries have a decreasing readership over time, and the survey results have shown that the Internet is already a regular method of communication and information for Subud members (see paragraph 2.9), as well as this being a well known fact of the wider community.
In the option given for a written response, respondents were voluble and took the opportunity to make their views known.
14% (29 respondents) felt that the effect of the latihan in members’ lives should be enough to inform people about Subud. Within this 14% no advertising or action was deemed to be necessary. E.g:
‘by living the message’,
‘Subud members living exemplary lives’,
‘as our individual growth increases our life naturally leads to more people being touched by the Latihan.
‘Follow Bapak’s advice and do the latihan properly’
‘Our own effect on people as decent human beings’.
‘Nothing. I don’t think we need to ‘sell’ ourselves to anyone, and if we are sincere in our worship people will be attracted. If we are not they will not be.”
Others within this 14% felt Members should set a general example more actively. E.g;
‘Examples set by Subud people doing beneficial and uplifting things in their lives and in the community is more effective than advertising. However we cannot sit back: have to be pro-active in making these interactions possible’.
‘Behaviour of members in the wider community’.
5% (11 respondents) of the total respondents were keen for Subud to use its halls for community events, which would be open to the public: E.g:
‘Activity doing good things within the community – not advertising but SD, events like fundraising, music raising etc. The events are projects that could be advertised and Subud mentioned.
‘Health groups, choral groups, relaxation clinics, craft groups’
‘participation in community events such as markets, fairs, fund-raising, events’
‘Events organised in latihan house which are open to the public and bring new people to us such as art classes, dance groups, music nights, fund raisers etc.’
‘Some form of community service - visioning days to help/lead people into looking outside the box - finding a new paradigm to cope with a changing world’.
‘Make Meaningful Contributions to local community affairs including Sica performances, SD activities, enterprises, and youth activities. In short, we need to do activities within the community that are relevant to the outside (Subud) community which attracts to Subud through our actions’.
2.5% (5 respondents) wanted specific charitable events, assisting local charities in collaboration with other organizations in projects for human wellbeing.
2.5% (5 respondents) mentioned the Internet.
4 respondents wanted more suitable facilities to which to bring people.
2 respondents wanted assistance with role playing workshops and information to enable members to feel more confident about approaching people personally.
2 respondents mentioned ‘Subud Enterprises – that make a real difference’.
Other comments included:
‘Public service announcements in police stations, drug rehabs, hospitals’.
‘A documentary – the ups and downs of the history of Subud’.
‘Good explanatory leaflets or brochures, books on Subud, good web info are all good supports for following up an individuals curiosity’.
‘Those in the Public eye – many in Subud – could acknowledge their standing.
‘Buddhist and yoga approaches to marketing are good to learn from – they do it well’,
‘Dropping the dogma’.
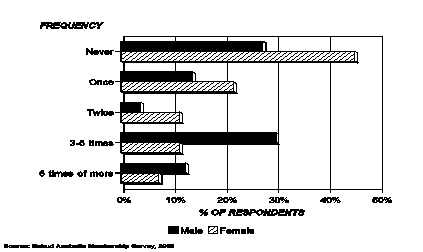
Speaking To Those Not In Subud
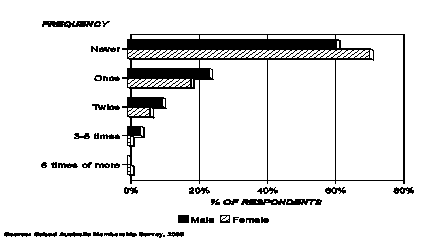
To the question, “How frequently do you currently speak to any non-Subud persons about Subud or latihan?” 30% of respondents replied either ‘weekly or monthly’; 33.5% replied ‘6 monthly’ to ‘yearly’ and 31% replied ‘rarely or never’. Probably males were less active in speaking frequently to new people about Subud and latihan and proportionately to women, were more highly represented in the ‘rarely or never’ category.
However, if members do not feel easy or confident to speak about Subud with friends, family and colleagues, then this previously rich information source is no longer as viable.
Should Subud Attract And Retain Members.
This question generated the largest number of written responses and was the most controversial, even before the survey was finalized and released to general membership.
Unfortunately the results are not entirely reliable, as the question design could have been improved. It stated: “Should Subud concern itself with trying to attract and retain new members?”. It would have been improved by asking it as two separate questions – i.e.
Should Subud concern itself with trying to attract new members?’
Should Subud concern itself with trying to retain members?’
Many people in fact wrote on their forms to indicate their intention of ‘yes’ to one part and ‘no’ to the other part, or else by their written comments in the space provided below the question, made their intention clear. Where this was not the case and they merely wrote ‘Yes’ or ‘No’, it is assumed the respondent meant ‘Yes’ or ‘No’ to both parts of the question. When time is available for a more full analysis of the results, we may have slightly altered final response data.
Graph 102 indicates that 53.5% (110) respondents felt Subud should concern itself with attracting new members; 35.5% (73) respondents disagreed; and 11% (23) respondents did not give a response.
Similarly to the section, ‘Should Subud concern itself with trying to retain new members?’ 57% (117) respondents said ‘Yes’; 26% (54) respondents indicated “No”; and 17% (35) respondents did not respond.
It can be taken for granted that although there are people who do not think there should be any attraction activity at all, that there would be very few or no people, who thought retaining new members was not a good idea. Hence this answer is probably not a true reflection of respondents’ wishes due to the question design fault.
How to Attract and Retain New Members.
Interestingly, many of those who clearly did not think Subud should concern itself with attracting new members still responded to this question. The most popular responses on how to attract and retain new members were, ‘friendliness/welcome’ and ‘member care’, at 48% and 40% of all respondents respectively. ‘Welfare’ and ‘public information’ each received positive replies from approximately 32% of respondents. Culture/arts’, ‘Helpers’, ‘Enterprise’ and ‘Youth’ averaged approximately 25% of respondents positive votes. ‘Conflict resolution’ and ‘better facilities’ came in at around 19% each. Respondents could give more than one answer.
The written responses to this section are more illuminating. Although the question was worded regarding attracting and retaining ‘new members’, the range of written answers covered both contingencies, with new and existing members, with specific suggestions about both new and existing members’ retention.
A summary of the written responses is as follows:
5.9% (12 respondents ) suggested ‘Setting good example in own living’. E.g.:
The Latihan was given to us by God almighty. According to Bapak's advice, we are the living prove (sic) of Subud. It is up to us to attract people to Subud by our actions.
I tick "conflict resolution" but this is NOT what I mean - I mean "Doing unto others as we would have them do unto us”. What Bapak always called trust, mutual love and acceptance - attracting new members is perhaps finally fully living our latihan, etc, and finally loving & trusting.
More communication & teamwork amongst different Subud enterprises. Finding synergies.
To attract new members - just being yourself. To retain new members - better communication among us.
We should not try & market SUBUD. People join because they see the proof of SUBUD in the members they know.
5.9% (12 respondents) wanted ‘Organisational change / Be more flexible and accessible’. E.g:
Subud needs to be more open & friendly & less judgmental. Less critical of those who explore other things, less exclusive. The latihan is wonderful but Subud is not the only organisation to have the latihan. It is present in so many things. Since moving away from the organisation I have discovered how wide & strong is the spiritual revival.
We should always be open and welcoming to new people. Subud needs to be more culturally sensitive - by this I mean we are in Australia - we should not be ashamed of being Western and modern. Some of the 'attitudes' to women's things, e.g. menstruating women, turn off young women. Too much emphasis on being Eastern/Muslim. Subud is bigger than this - or it should be. Get into the 21st century.
Very important Subud is visible, open, and approachable by members of the general public. All Subud groups should put in place ACTIVE steps to achieve this.
I feel Subud should be open to more people, because people would benefit from it - not for Subud's sake. I think there are some off-putting things about Subud that turn people away when really all it is the simple experience of the latihan. This is clouded with some funny "thus saith Bapak" rules when they say there are no rules. I think the very Indonesian sounding name of latihan is itself a difficulty.
Should remember to be more flexible and to maintain communication with new answers for Subud members to have more information.
5.9% (12 respondents) suggested ‘Advertise, promote, make public information available’. E.g:
So far Subud has been, and is, an almost secret society. I think we should be putting notices in new age magazines EVERY MONTH, with the Subud symbol a phone number and an email address! (We NEED a Subud Perth Email Address and a website).
To grow we must put Subud out there for the general public by open days, articles, notices of latihan times - information not proselytising!
As the present membership of Subud is, on average, approaching retirement age, the influx of younger members is vital for Subud to continue. At the moment younger members are mainly 2nd or 3rd generation Subud members.
If Subud does not attract new members, it will die, and the latihan would be lost to the world. This would be a tragedy. Let's get our act together!
3.9% (8 respondents) listed ‘Better care of new members / existing members’.
We should have a holistic view to caring for new members especially as it takes time for them to recognize the value of the latihan. Something for the heart - mind is good. E.g. social cultural interaction, books.
I think more emotional support needs to be offered to new members (particularly 1st generation) where the latihan may be their 1st real experience of the reality of the spiritual worlds.
The retention of newly opened members is most important. This is the responsibility of helpers & committee. Too often member gets lots of attention before being opened & then is ignored.
Worry about the members we do have and not the ones we don't have. Member care is the vital ingredient. Everything good spreads best by word of mouth.
I personally think the new applicant process can be extremely off-putting to people interested in Subud.
3.9% (8 respondents) listed ‘Not necessary / God will’.
While more members would token a more vital fellowship, Bapak seems not to have been unduly concerned with the size of Subud, suggesting that 'god wills'. It is difficult for any organization built around a charismatic leader to survive the demise of that leader for very long, without being 'routinized' (to quote Max Weber).
I don't really believe it is the role of Subud as an organization to try and attract or 'recruit' new members. I believe the group is there to answer questions (that they feel they can) and inform those interested about their experiences of the latihan but that trying to 'attract' new members is not really what is advised. People seem to find the latihan and Subud when the time is right for them, and I don't think that wider promotion of Subud will necessarily assist in people finding what they need from Subud and the latihan but perhaps give people the wrong impression of what it is about.
A feeling that we must get new members (& panic about dwindling numbers) comes from the heart & mind & we shouldn't use this to attract new members.
2.9% (6 respondents) listed ‘Quality of our latihan’.
Strong latihan = satisfaction with SUBUD = oneself! Leads to interest in the SUBUD ORGANIZATION & the willingness to give in any way possible. There is not much space yet to receive what people wish to give or visa versa. New members follow on from SUBUD growth.
What is most important is for the Subud member to follow and be diligent in the latihan and carry this through into his/her daily life. It is much better to have a small number who really follow the latihan than a large number not really committed to the latihan.
Spread of SUBUD is in God's domain, and when we are in the right quiet state, people will be attracted to the latihan.
2.9% (6 respondents) suggested ‘Helpers behaviour’.
Helper should be normal not officious, superior in any way. All members should feel responsible for welcoming new members. Helpers should follow the opening of new members. Offer appropriate encouragement when needed.
Would be good to encourage renewal of helpers - rotate role through the membership more readily. People can get stuck in the function and leave space for others when it might be right/good for them to have a go.
I would like to see a lot less "judgment" about new applicants, as if "filtering" out the less attractive potential members, at least in the eyes of the helpers. I notice preferences quite often - it's not unconditionally welcoming to all.
2.4% (5 respondents) wanted ‘Community events / work’.
Address own shortcomings; restrain immature helpers; encourage new members ; devise communal projects, use whatever assets are available as levers to make inroads into the community at large for good social objectives. Last but not least mature in the latihan for maximum effect. This means doing good work in the community at large.
It will be great when we can do more in the community in health, culture, education, social tolerance - but I believe it is generated by Subud people who are ready for these commitments and contributions.
I think we could attract new members and retain old ones by actions rather than talk - eg working in community if possible in SD Capacity. Also making any build-up and places of latihan as an attractive as we can.
4.9% (10 respondents) listed ‘other’.
Subud in Australia is a bit like a federation. Local groups retain most people’s involvement. National level should be focused on doing those things that support the local groups. Make them stronger. Part of the struggle of course, is that unlike the Australian federation, most power, including revenue, is still with local groups. Appropriate property management would be a good national activity if you could get agreement... An interesting question would be whether there is any correlation between local group 'success' and the quality/nature of their group space. (Owned? 1/2 lat spaces? used by broader community? visible?).
My own shortfall in terms of attracting more members is that I am very shy and nervous about talking about Subud. I have tested it a couple of times. Might be useful for helpers to propose some tests for members at Kejiwan days about how we communicate about Subud and the latihan.
Embrace quality of relationships. Subud far too concerned it seems with image and statistics - looking business like. I get enough pressure to perform better and higher at work. I don't want to hear about such talk in Subud circles. Nurture what there is and celebrate what we have now. Less negative talk more positive talk. Helpers or Chair should never be expected to give 'talks' about Subud. They will inevitably find themselves defending and justifying their practices of the latihan to people who may have ungenuine (sic) intentions. This is a terrible way to treat Subud members. As we are speaking of deep and very real experiences not selling a product in a shopping mall.
Somewhere Bapak says we should not worry about getting more members, but if we grow adequately with the latihan people will be attracted to Subud. However we don't use the latihan enough in our daily life. So far as finance goes most Subud people are not very worldly about money. We tell people they don't/can't pay for what the Almighty gives them. But we don't do enough making people aware that the facilities they use are not financed by the Almighty. All the "Older Age" groups I belong to have to put something in $2 or $3 each time they come towards rent, upkeep, etc, etc. We also have National & International needs. Perhaps we should do more publicly about THEIR needs, as well as the groups. When we see what the Churches do to raise money I wonder how they manage it.
The other key area of Nat Comm. support is for national helper travel and the provision of ready access to Ibu Rahayu's talks and YM Bapak's talks to support spiritual growth, development and awareness/clarification.
Further comments appear in full in the Addendum.
In summary, the majority of respondents were clearly in favour of ‘attracting’ and ‘retaining’ new members, with a distinction made by some of those who dissented, between ‘proselytising’ and ‘informing’.
The Australian Oxford Dictionary defines proselytizing as ‘trying to convert people to one’s beliefs and opinions’, whereas ‘informing’ carries less of an ulterior motive and is seen in the Oxford Dictionary as a more simple ‘giving information’ or even a less active meaning of ‘facts told or discovered’. This was equated in some of the survey responses to ‘a sharing of one’s experience’. However, in reality the difference may not be so clear cut when analyzing the underlying intentions between proselytizing and informing. Possibly the flavour of the intention is carried more via the teller’s manner, a reciprosity and a high level of genuine interest in the listener’s own beliefs, views and experiences.